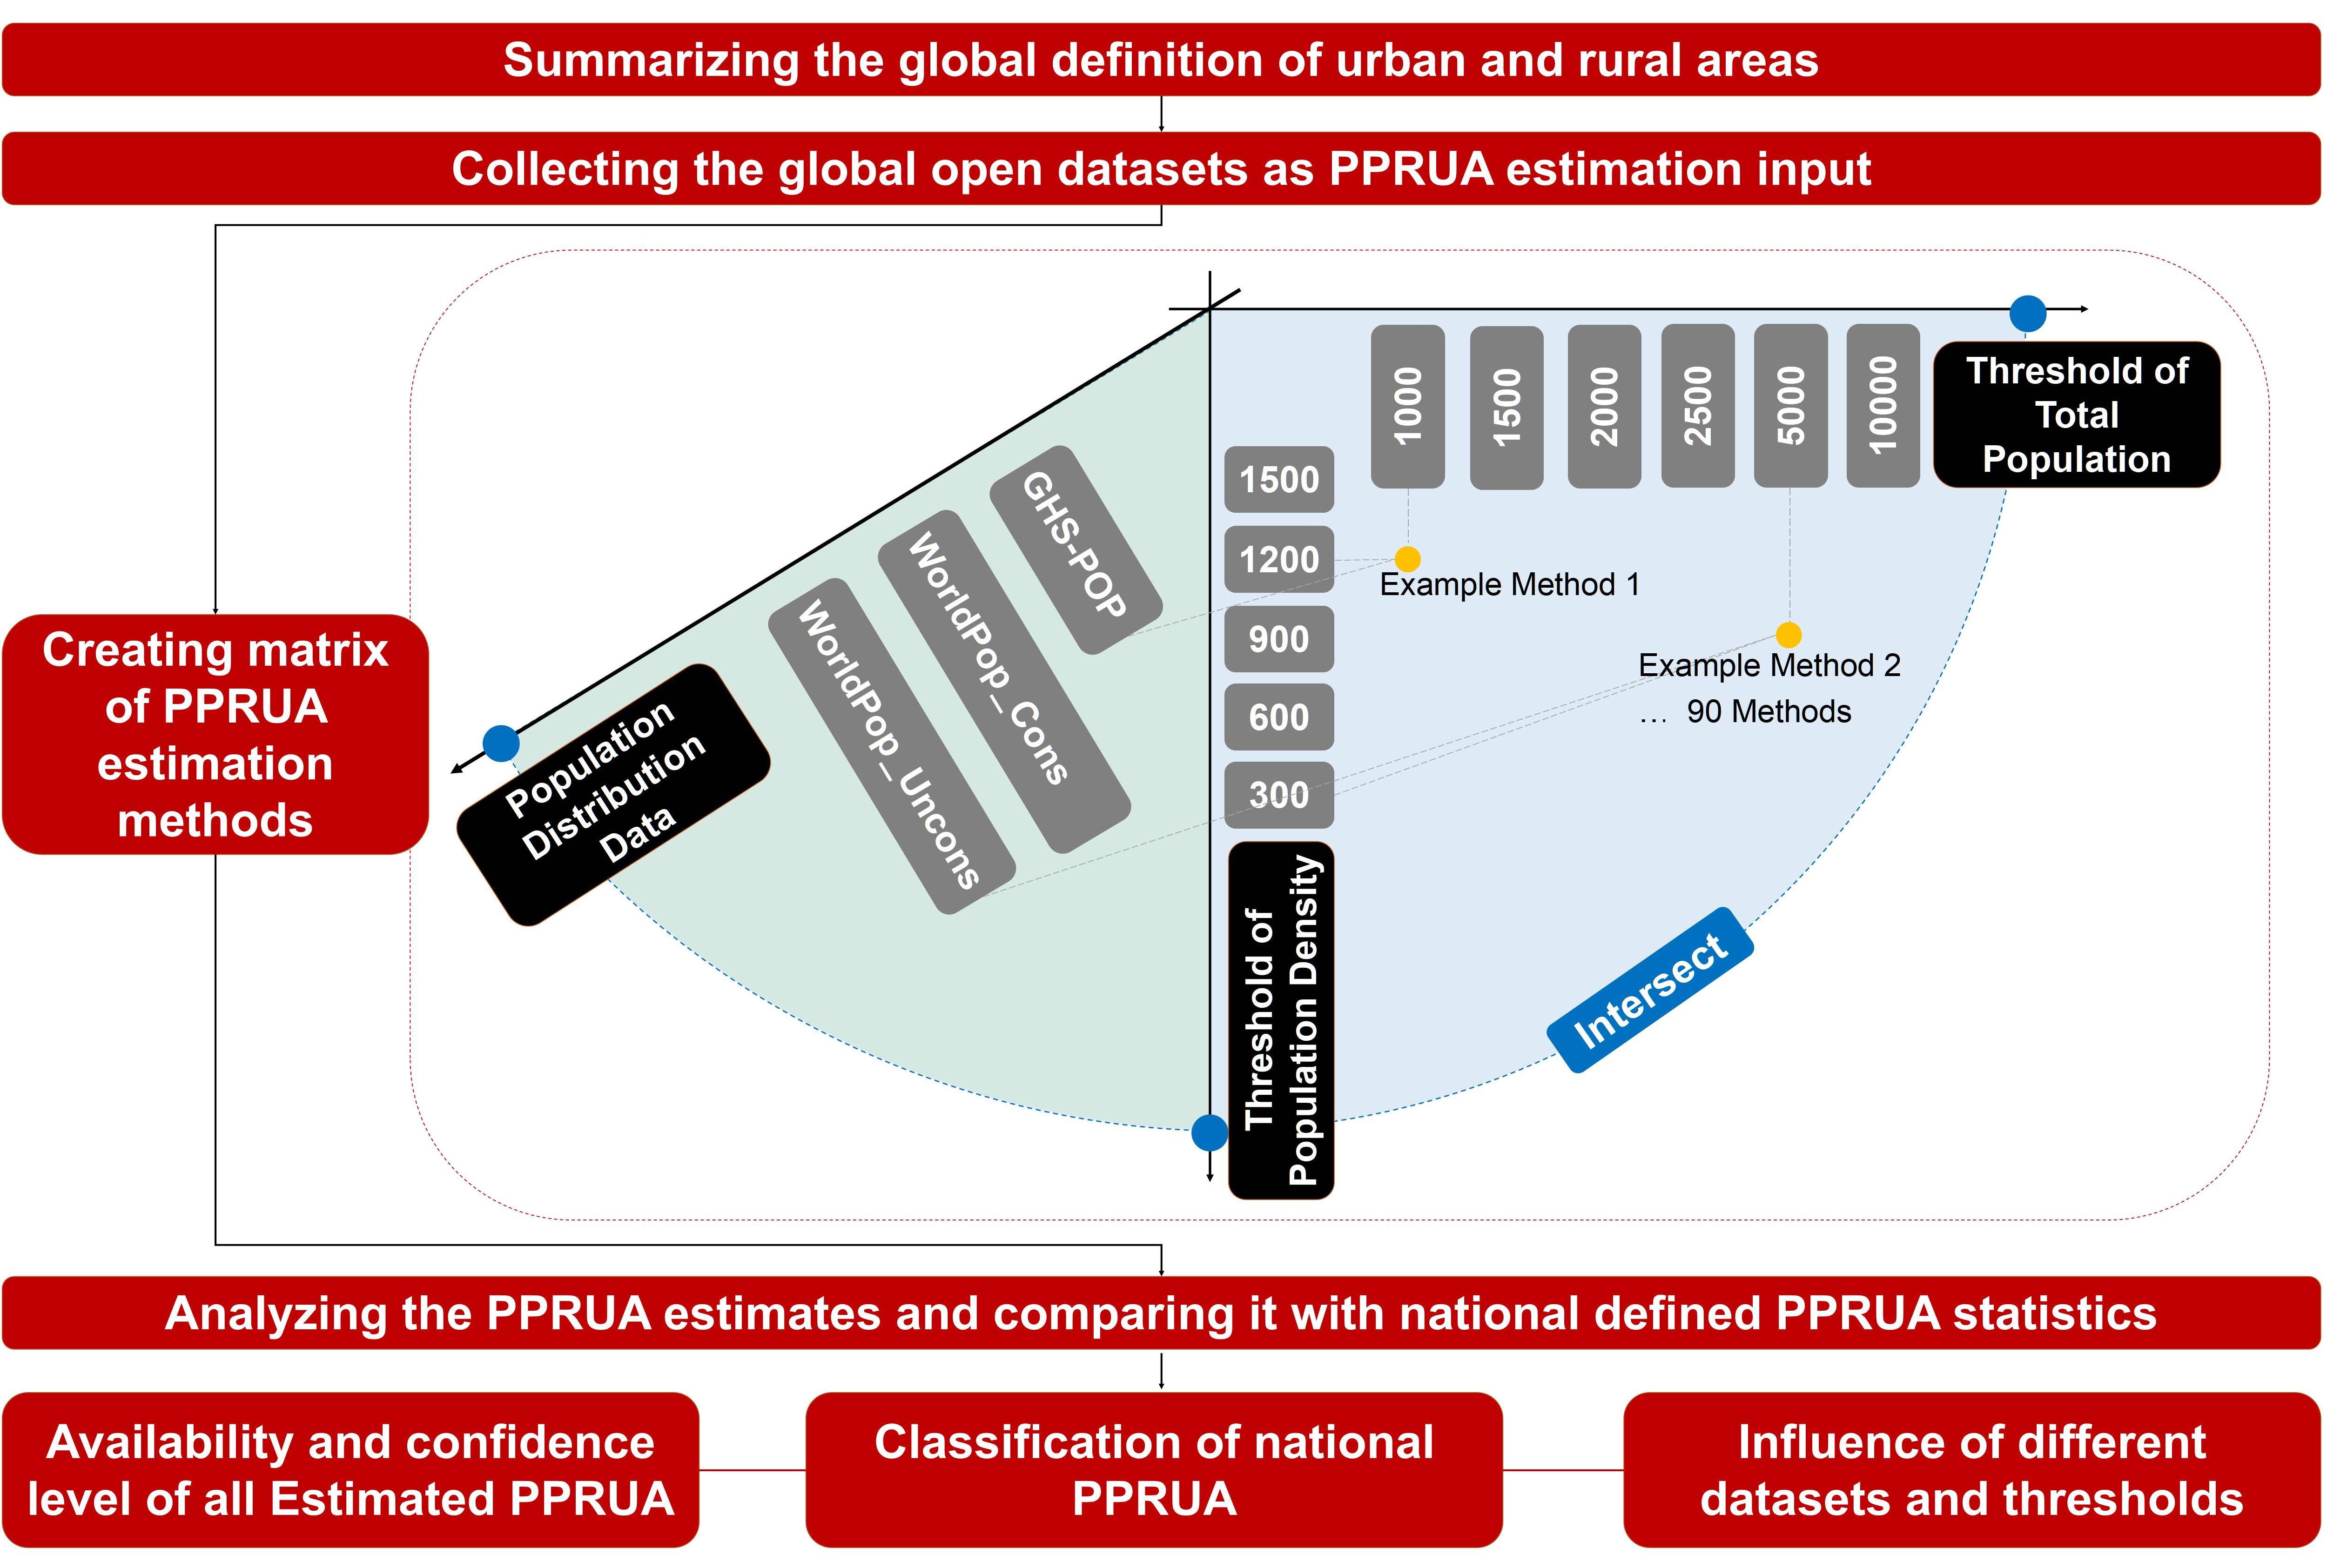
The UN (United Nations) collects global data on the country-level Percentage of Population Residing in Urban Area (PPRUA). However, variations in urban definitions make these data incomparable across countries. This study assesses national defined PPRUA within UN statistics against estimates we derived using global comparable definitions. Refer to the UN's Degree of Urbanization framework, we propose 90 global harmonized methods for estimating PPRUA by combining different configurations of three global population datasets, six urban total population thresholds, and five urban population density thresholds. This approach demonstrated significant variations in country-level PPRUA estimations, with wide 95% confidence intervals. Most national defined PPRUA fall between the upper 95% CI and the median of the estimations, underscoring the need for globally harmonious PPRUA estimates. This study advocates for a reassessment of datasets and thresholds in the future and investigating urbanization on a scale beyond the country level.
联合国收集国家一级城市地区人口百分比的全球数据。然而,城市定义的差异使得这些数据无法在各国之间进行比较。本研究使用全球可比定义得出的估计值,评估了联合国统计数据中国家定义的PPRUA。参考联合国的城市化程度框架,我们通过结合三个全球人口数据集、六个城市总人口阈值和五个城市人口密度阈值的不同配置,提出了90种全球统一的方法来估计PPRUA。这种方法显示了国家一级PPRUA估计值的显著变化,具有较宽的95%置信区间。大多数国家定义的PPRUA介于95%置信区间上限和估计值中值之间,强调了全球统一PPRUA估计值的必要性。这项研究主张在未来重新评估数据集和阈值,并在国家一级以外的范围内调查城市化。未来将在进一步的时空尺度上评估该领域。
备注:模型、代码和不同情景的全球城市边界数据见联系方式,全球不同情境下各国城镇化率水平以及其他开源人口数据的分析结果见论文附件 :https://www.cell.com/iscience/fulltext/S2589-0042(24)01350-6
论文:Li, W., Zhang, Y.(Co-First Author), Li, M., & Long, Y*. (2024). Rethinking the Country-Level Percentage of Population Residing in Urban Area with a Global Harmonized Urban Definition. iScience.
Figure 1 Thresholds of population size and population density in urban definition, from the UN

The solid bar charts represent the thresholds selected as rational ones and used in the estimation configurations in this paper.
Figure 2 Estimated PPRUA for all scenarios represented by the 95% CI and median at the country level, ranked by national defined PRRUA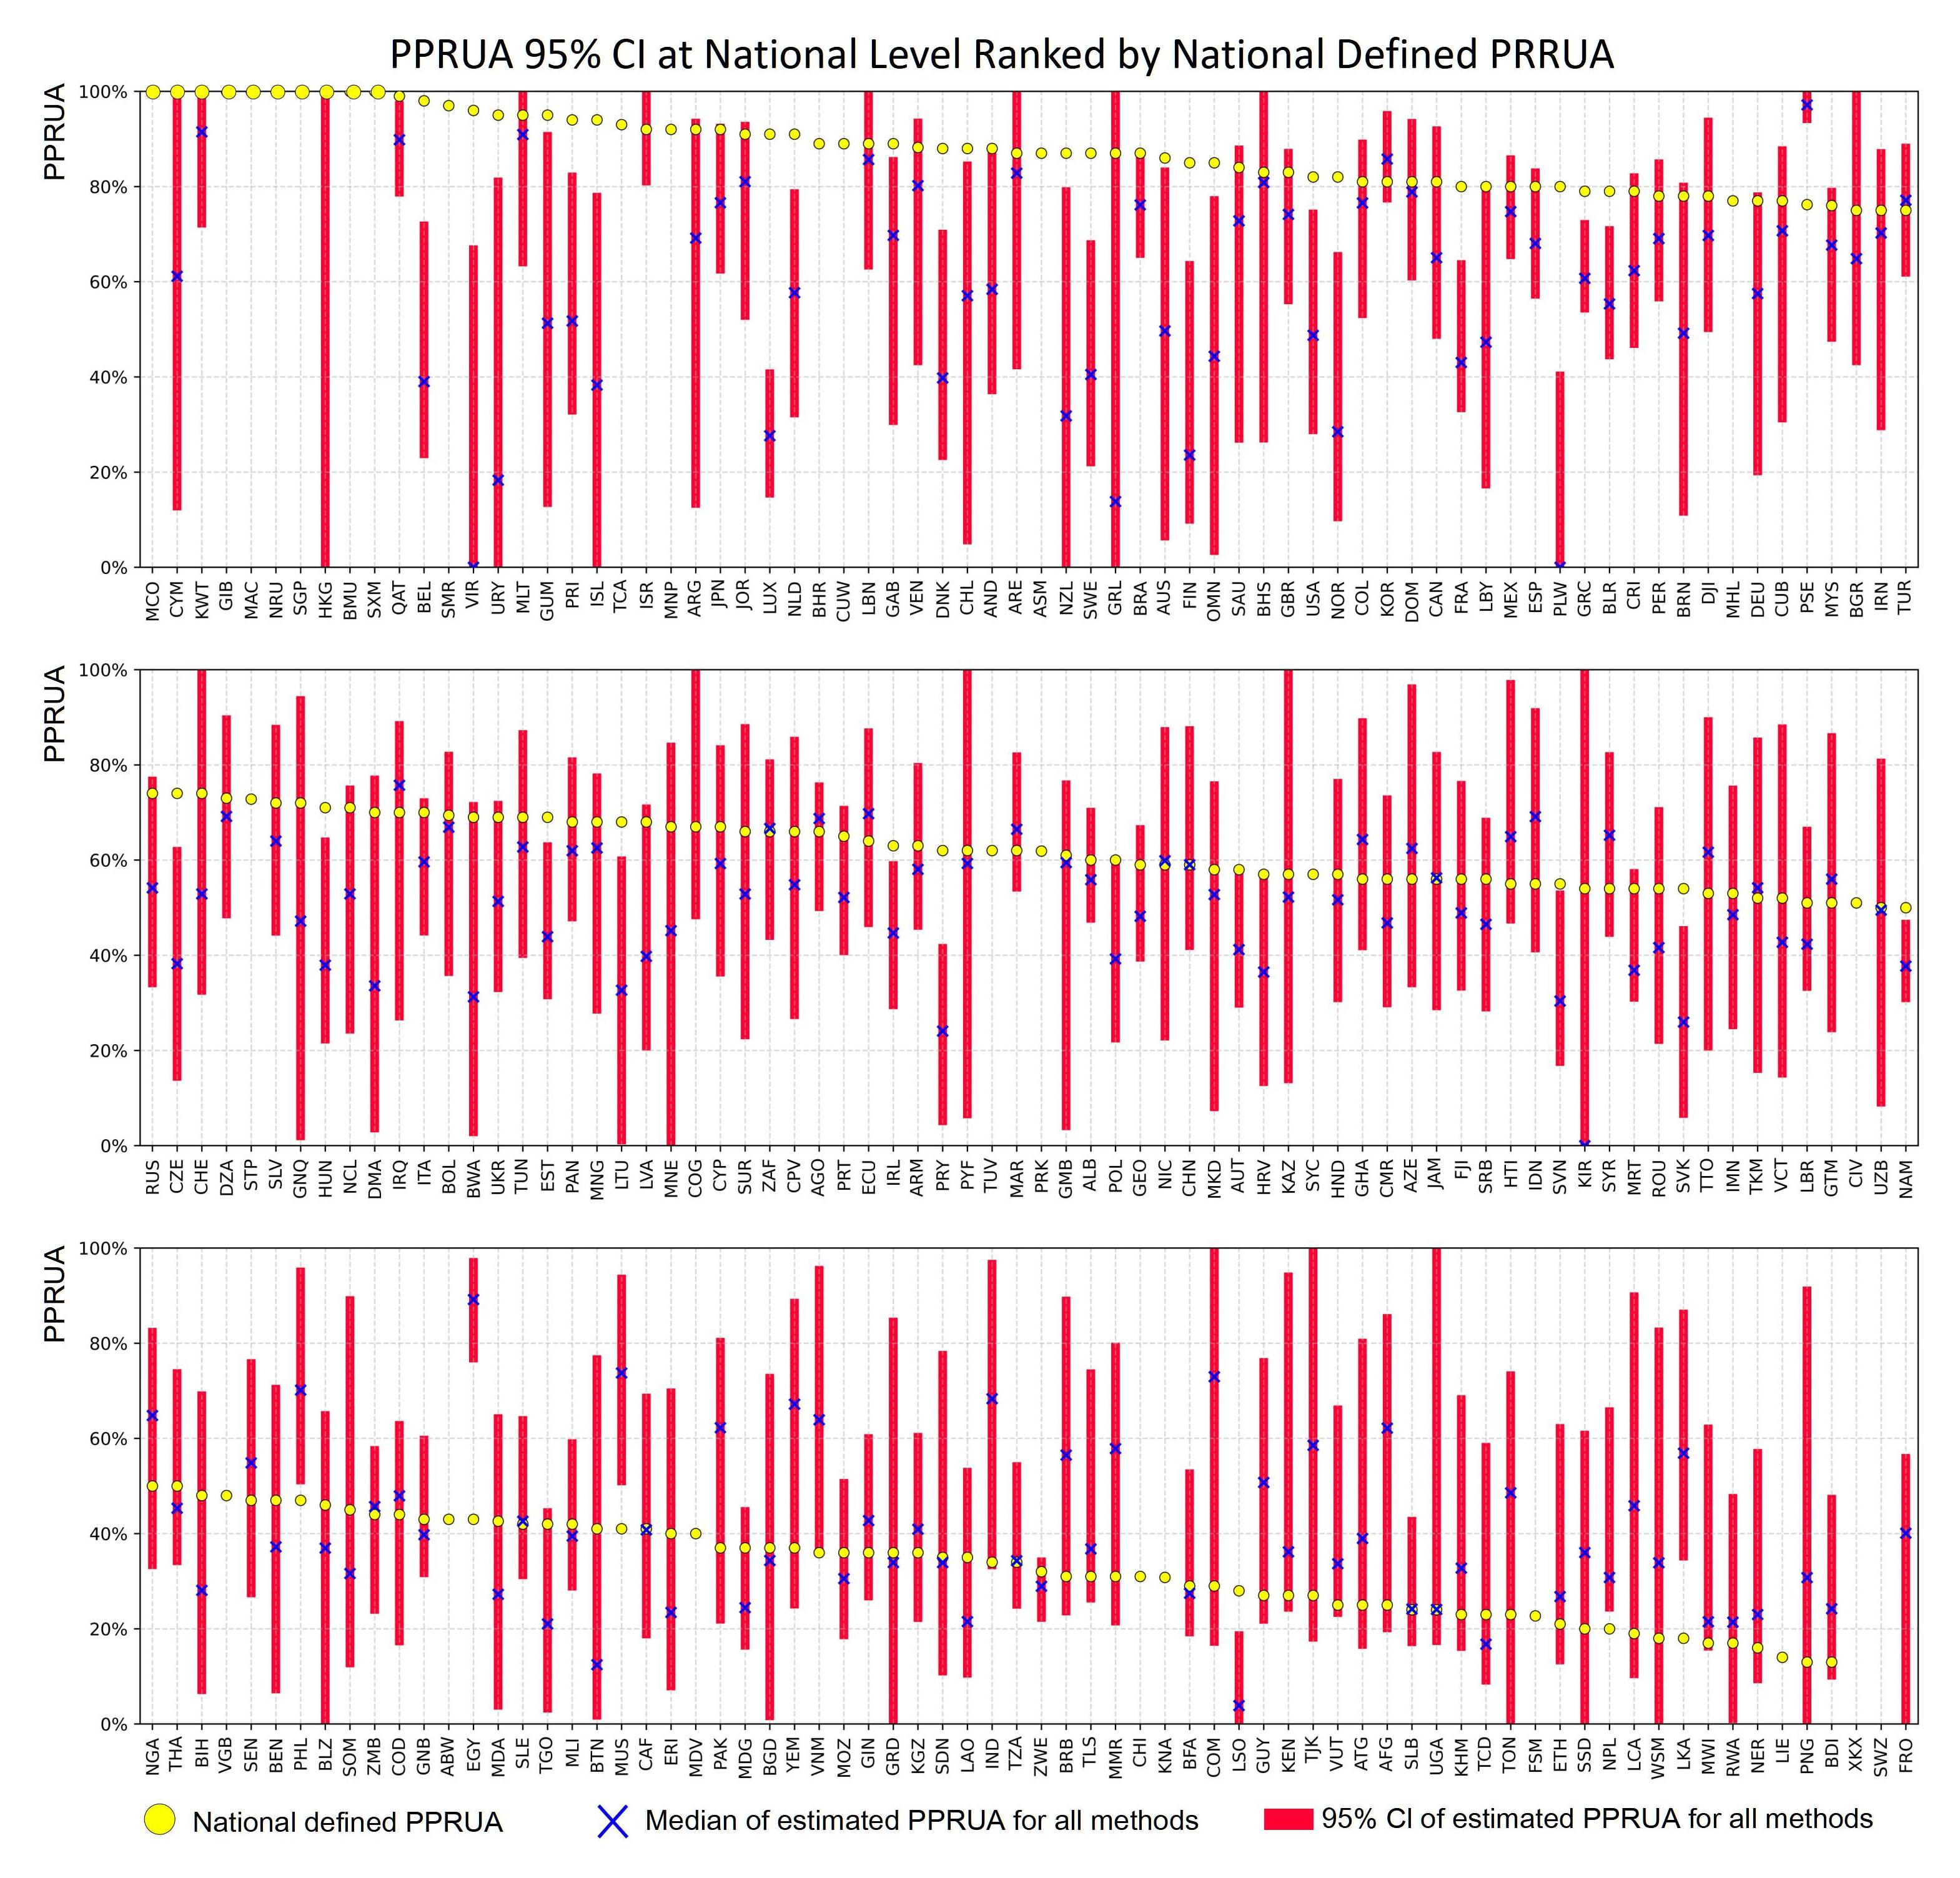
Figure 3 Classification of national PPRUA

1) “Overestimated”: UN's PPRUA > upper limit of estimated PPRUA 95% CI. 2) “High”: Median of estimated PPRUA 95% CI < UN's PPRUA <= upper limit of estimated PPRUA 95% CI. 3) “Low”: lower limit of estimated PPRUA 95% CI <= UN's PPRUA < median of estimated PPRUA 95% CI. 4) “Underestimated”: UN's PPRUA < lower limit of estimated PPRUA 95% CI. 5) Because of the lack of UN statistics or the unavailability of PPRUA estimation results (cf. Table 2), NO DATA means there is no data for these countries to consider their classification (see Table S5). This map does not represent the official views or positions of any country or organization, nor does it imply the recognition or denial of any sovereignty or territorial claims. This map is for reference and learning purposes only and has no legal effect. 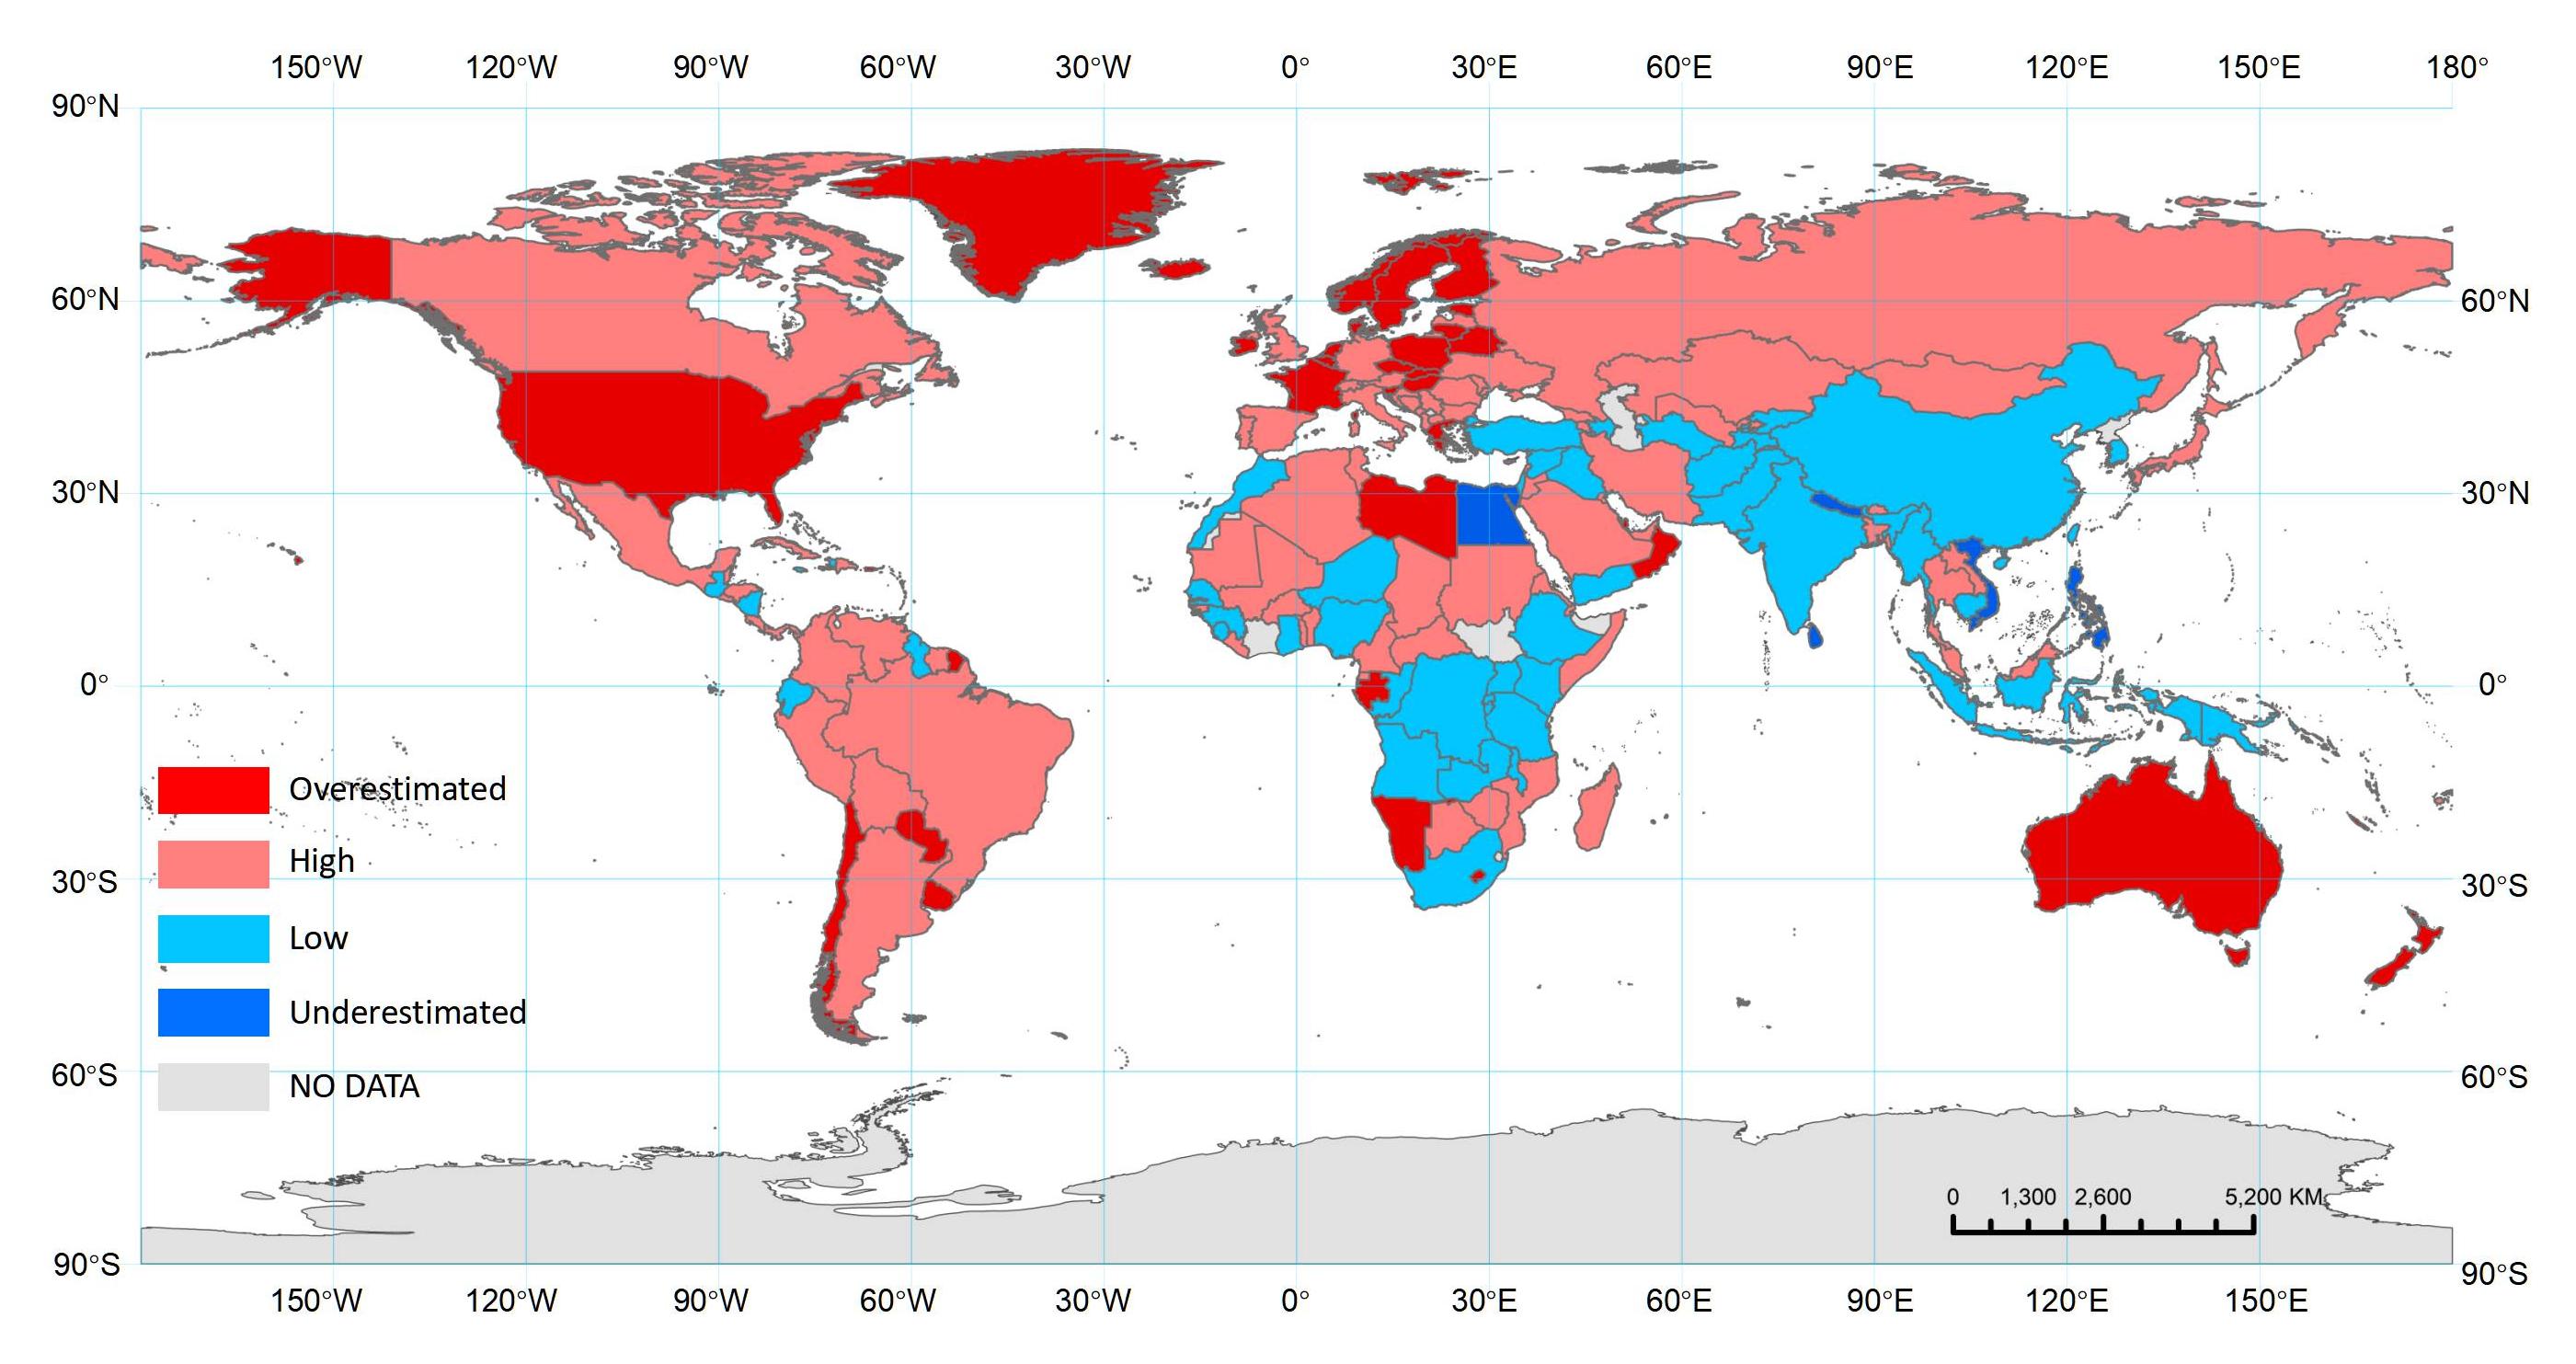
Figure 4 Classification of national PPRUA by continents and income groups

The upper number in each thermal grid represents the number of countries, and the lower percentage represents the proportion of the number of countries in the continent or income category in the deviation category to the total number of countries in the category.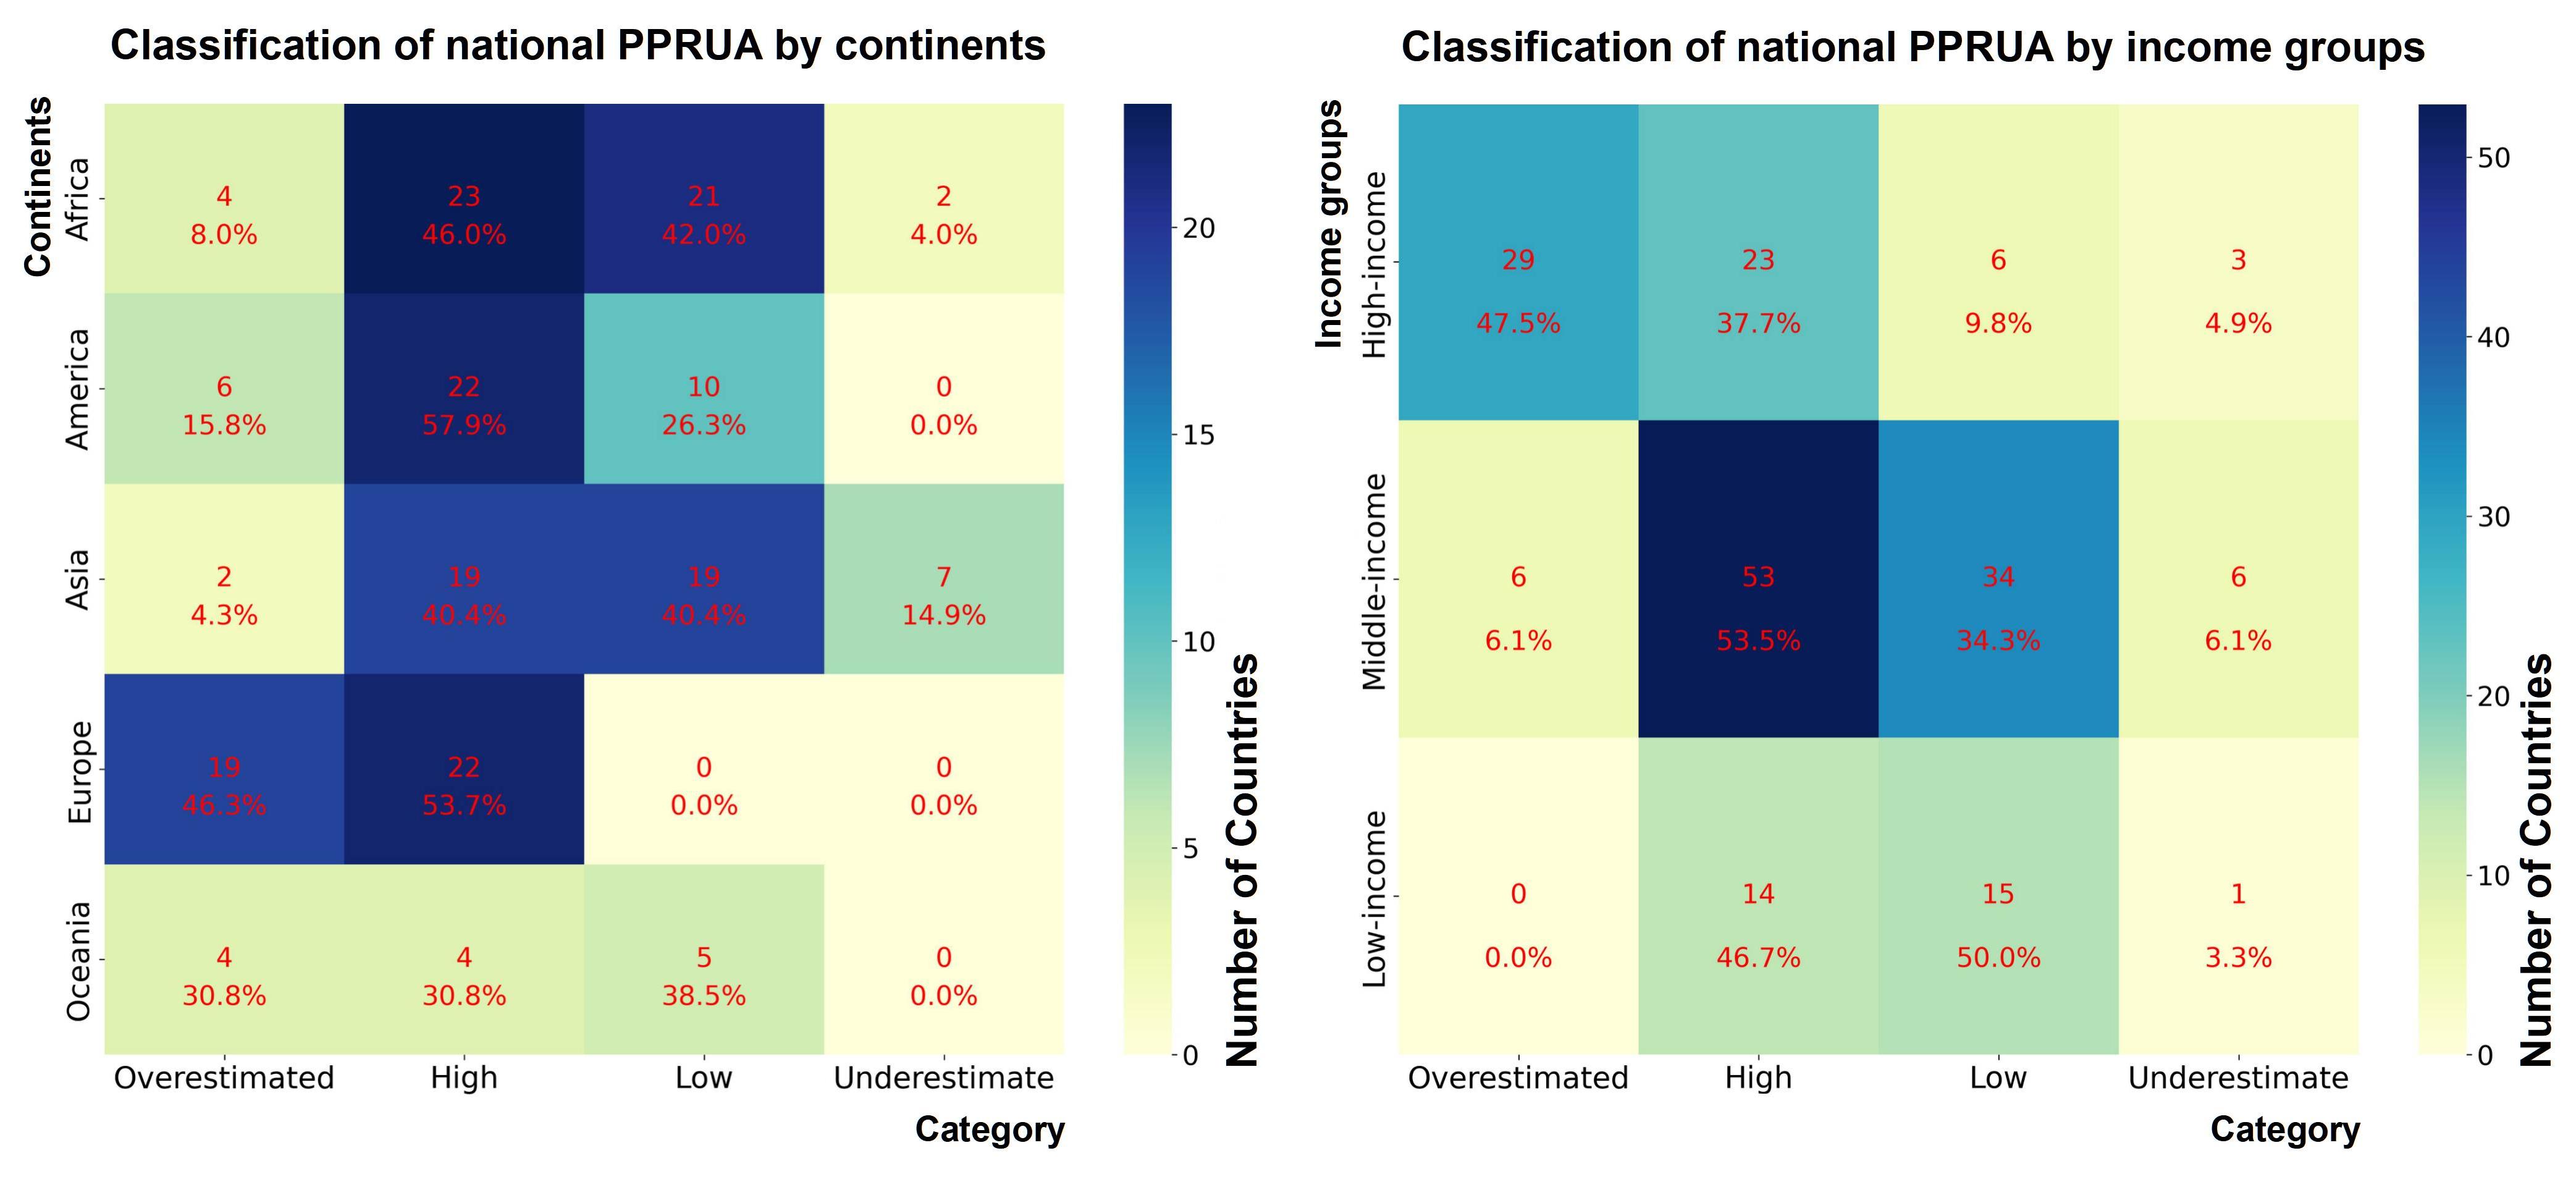
Figure 5 Contribution of different data and thresholds to the inequality of estimated PPRUA results in different regions

Blue sector represents the proportion of between group inequality (Disparity across categories. A higher Db indicates more divergence between groups), and red sector represents the proportion of the within group inequality for each subgroup (Disparity within a category. A higher Dw points to more disparity within that specific group). (a) Inequality of the results decomposed by different population distribution data; (b) Inequality of the results decomposed by different population density threshold; (c) Inequality of the results decomposed by total population threshold. 
Figure S1. Comparison of regional PPRUA calculated by different global population distribution datasets (results are the average number of PPRUA by different global population distribution datasets and the same threholds)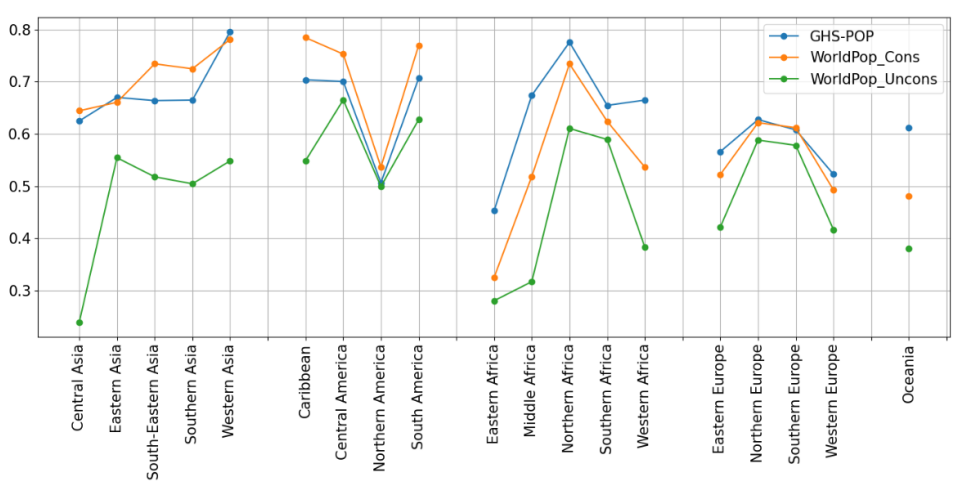
Figure S2. Percent growth in PPRUA and GDP per capita according to national income and region for all scenarios.

GDP data comes from the World Bank (2023).(a) and (b) respectively represent the box charts of the regression coefficient k of PPRUA and GDP per capita in all scenarios of the countries calculated according to the national income classification and the national regional classification (the box charts represent the first and third quartiles, median and abnormal values). P values of all regression models are less than 0.05. 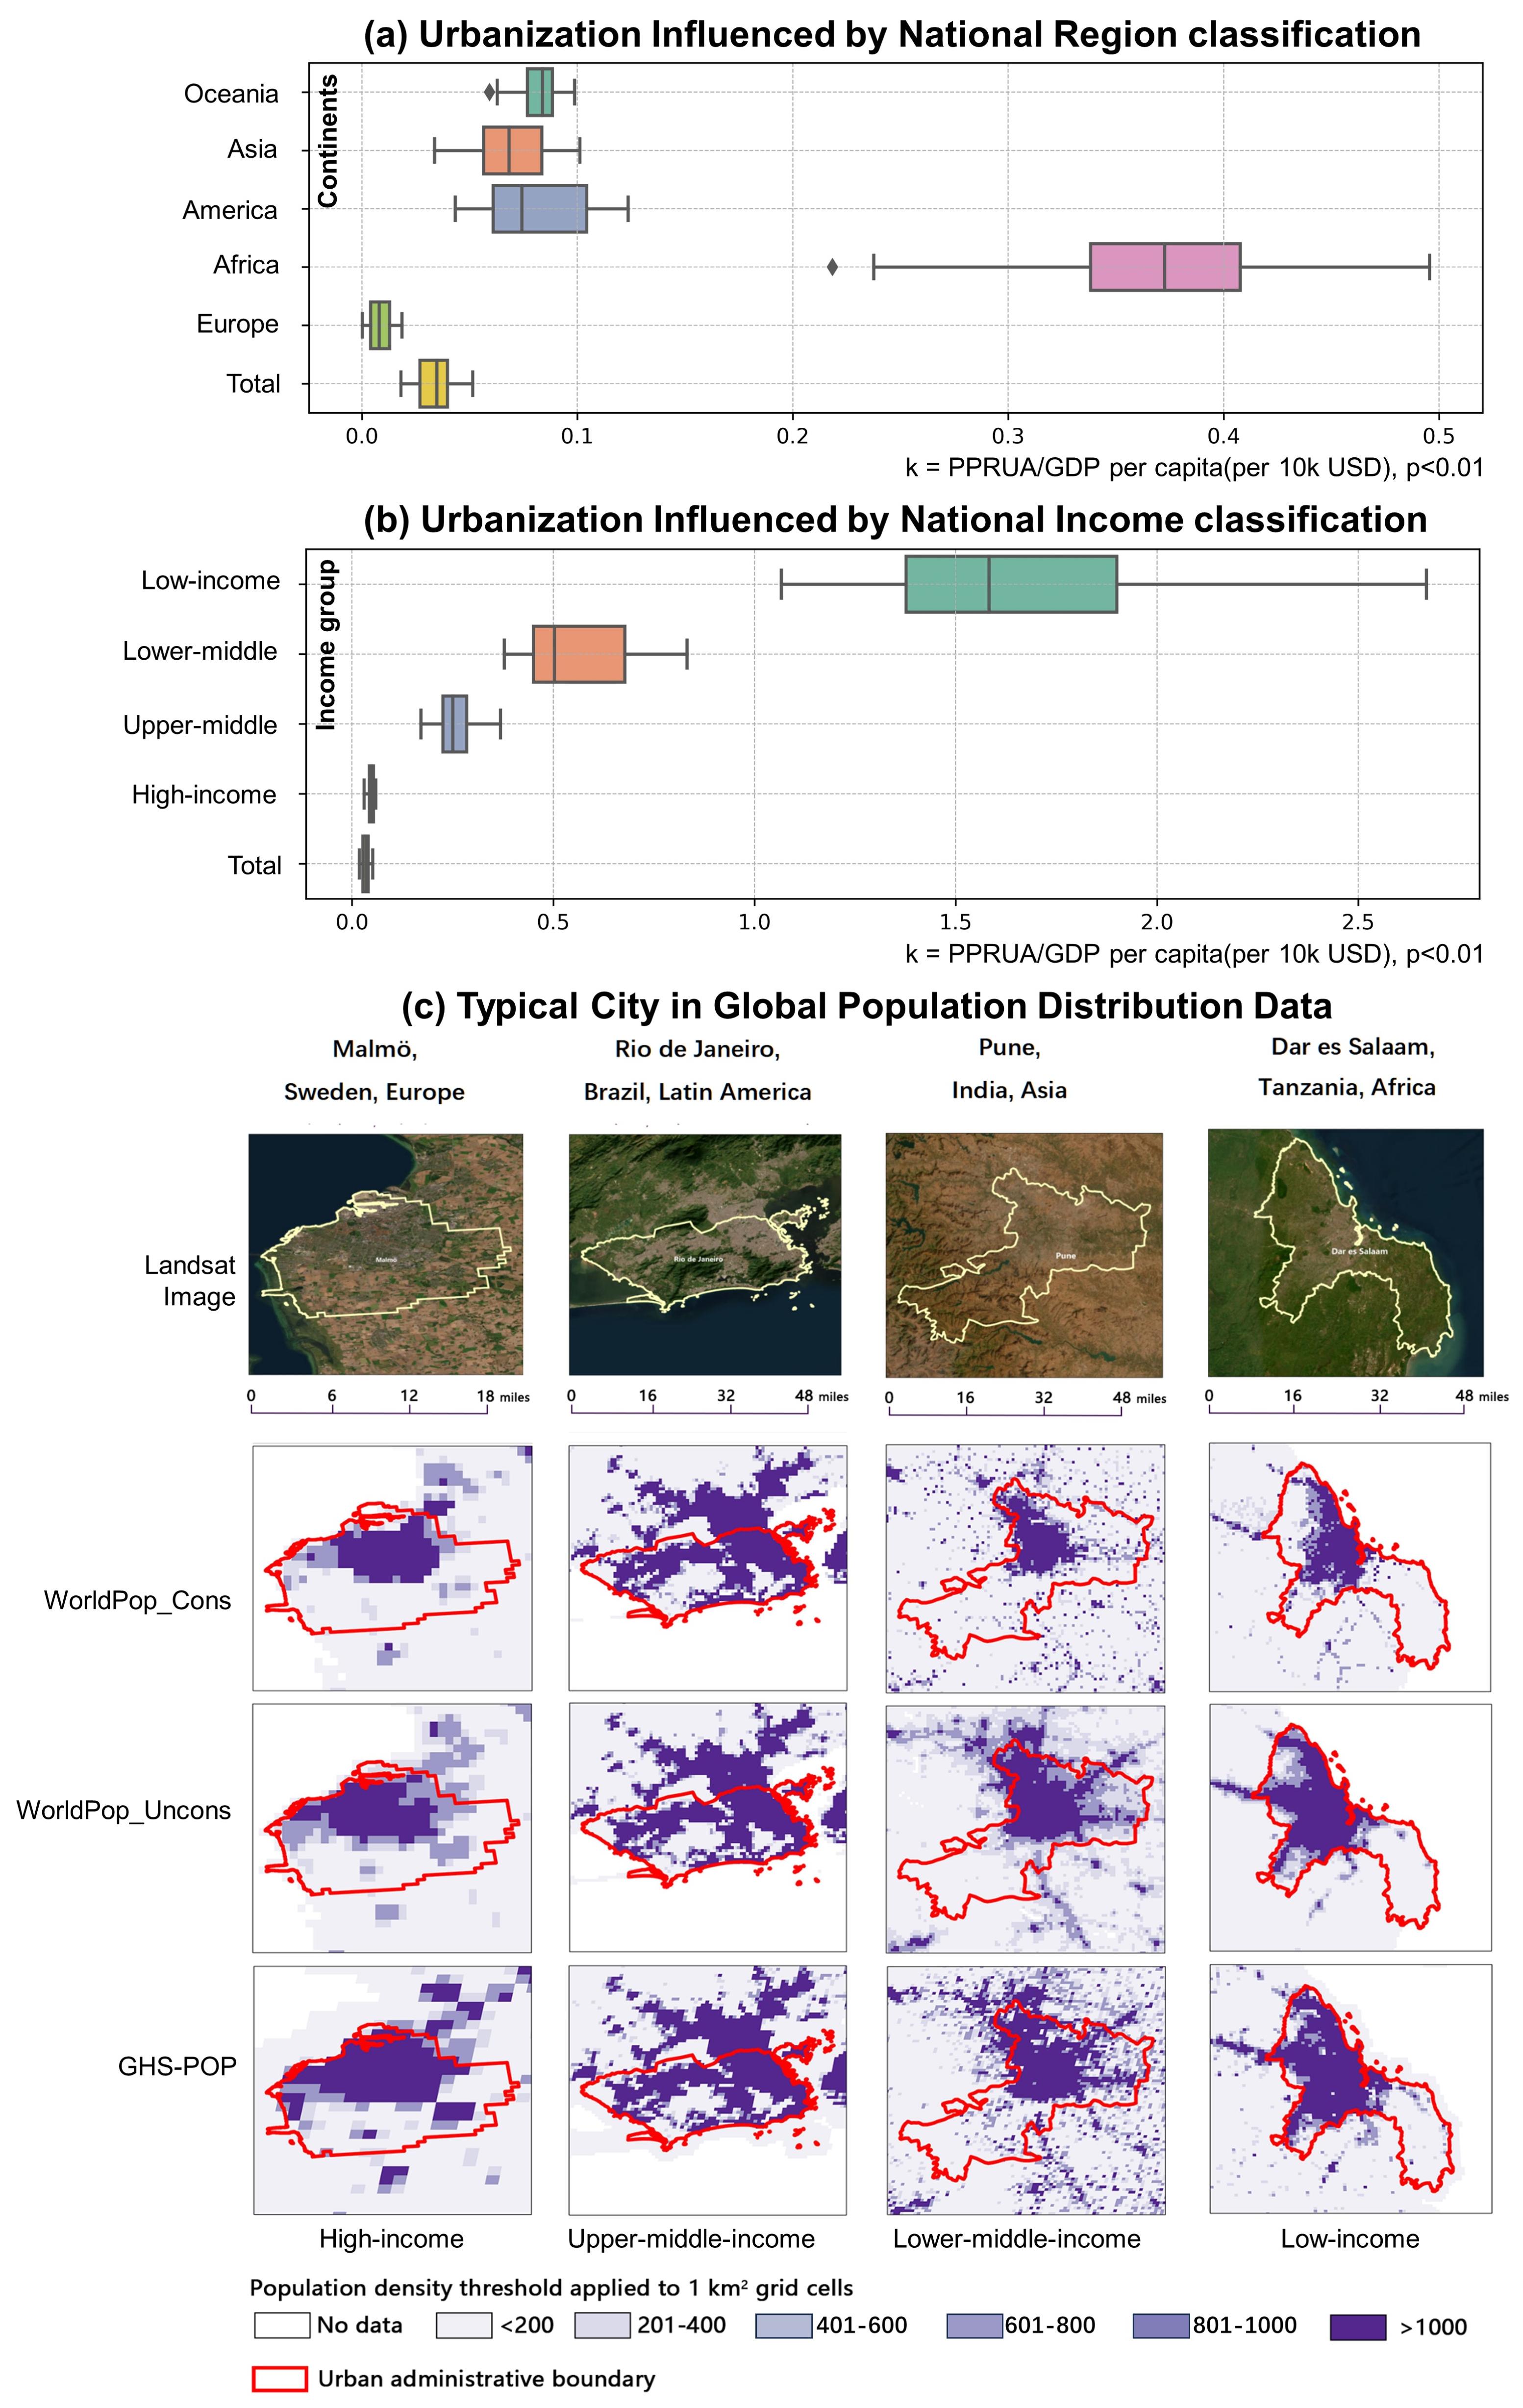
Graphical Abstract